High Tide Alert!
Higher tides are expected to occur more often June through December and may contribute to coastal flooding. Residents are encouraged to monitor conditions for local flooding and time trips accordingly.
Resources and Tools
Upload your King Tide Photos
Explore maps and photos: Floods Crowdsourcing Map
As a reference, the average predicted high tide for South Port Everglades Tidal Station is predicted to be at 0.41 feet
NAVD.
September 7 - 12, 2025
| 1.23
| Wednesday, September 10, 2025 10:54 AM
|
September 22 - 23, 2025 | 1.04
| Monday, September 22, 2025 09:24 AM
|
October 4 - 12, 2025
| 1.62
| Wednesday, October 8, 2025 09:43 AM
|
October 18 - 24, 2025
| 1.17
| Tuesday, October 21, 2025 08:56 AM |
November 2 - 10, 2025
| 1.67
| Thursday, November 6, 2025 08:25 AM
|
December 2 - 18, 2025
| 1.36
| Friday, December 5, 2025 08:11 AM |
These predictions are based on the South Port Everglades Tidal Station operated by NOAA. This is the closest station that will be fully monitored. This operational station gives up-to-date tidal information, wind speed/direction and temperature data.
In addition, NOAA extrapolates predicted tides throughout various sites in Broward County. In the map below, please click on a station name to be redirected to that station's specific predictions that are offset for height and timing for that location. Note that these predictions are based on gravitational forces only and that offshore weather (winds, currents, and/or storms) often will magnify or diminish predicted tides.
Broward County Tide Prediction Locations
Observed current and historical water levels data for South Port Everglades station can be found
here on the NOAA website. The Advanced Hydrologic Prediction Service from National Weather Service (NWS) also provides the current observed tidal water level data in reference to NWS/NOAA established Minor, Moderate and Major Flood Risk Thresholds
here. It should be noted that the observed high tide flooding threshold in Broward County is generally lower than the NWS/NOAA established official threshold of 1.87 ft NAVD88 at South Port Everglades station. In Broward County, high tide flooding in several low-lying areas may occur when the tidal levels are above 1.4 ft NAVD88.
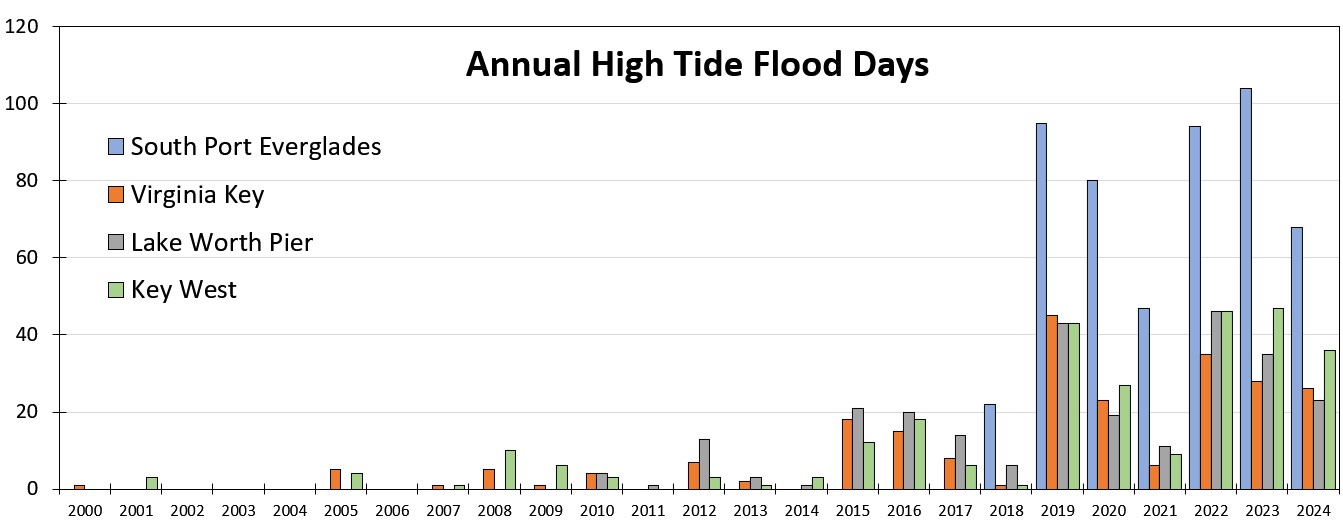
High Tide Flood Days
The figure below shows the annual number of High Tide Flood days calculated based on the NOAA tidal gauge data at South Port Everglades, Virginia Key, Key West and Lake Worth Pier. NOAA/NWS established high tide flood thresholds were used to calculate the number of flooding days for Virginia Key (1.53 ft NAVD), Key West (1.11 ft NAVD)) and Lake Worth Pier (1.85 ft NAVD). For the South Port Everglades gauge, locally observed high tide flooding threshold of 1.36 ft NAVD was used to calculate the high tide flood days. Based on the NOAA definition, a flood day occurs when verified hourly water levels exceed the flood threshold for at least one hour. NOAA monitoring for South Port Everglades and Lake Worth Pier started in 2018 and 2010, respectively, therefore, calculated flood days are also shown starting from these years.
More information
SFWMD Metrics Hub
SFWMD Enhanced Tide Predictions
Tide Predictions - NOAA Tides & Currents
2021 State of High Tide Flooding and Annual Outlook
2019 State of High Tide with a 2020 Outlook
FIU Flood Monitoring Project
Inundation History - NOAA Tides and Currents
Catch The Tide Miami - Peeking at Future Sea Levels
Contact
Gregory Mount, 954-519-0356
